Translate


430.1 Acceptable Hydrology Methods (Detention Hydraulics)
Engineering accepts the Rational Method, and TR-55, in addition to WES approved methodology. Other methods will require prior approval from Engineering.
Detention pond routing shall be by the Storage Indication (Modified Pulse) method:
{2S²/ Δt + O² = I² + I¹ +2S¹/ Δt + O¹} or approved equal.
430.2 Rational Method
The Rational Method (Q=ciA) may be used to estimate peak discharge from drainage basins of less than 300 acres.
The Soil Conservation Service ("SCS") TR55 method may be used for drainage areas less than 25 square miles.
Refer to the ODOT Hydraulics Manual for additional information. Some of the figures contained herein have been reproduced from the above manual.
430.2.1 Rational Method Basic Methodology
The Rational Method is a simplified model for estimating the discharge of a drainage basin based on the area of the basin, type of ground cover, and intensity of rainfall.
Q = ciA
Q = peak discharge (cfs)
c = runoff coefficient
i = rainfall intensity (in/hr)
A = drainage area (acres)
The Rational Method can result in a wide range of discharge values based on assumptions made by the Engineer. The following sections establish parameters for the variables in the Rational Method and should be used in the design of drainage systems within Clackamas County.
430.2.2 Runoff Coefficient
The runoff coefficient (C) is a dimensionless parameter based on the type of ground cover and slope of the terrain. Table 4-1 lists runoff coefficients for various conditions of ground cover and slope.
Where ground conditions vary throughout a drainage basin, a composite runoff coefficient can be calculated as follows:
Cavg = (C1A1 + C2A2 + C3A3 + . . . CnAn)
(A1 + A2 + A3 + . . . An)
430.2.3 Rainfall Intensity
The rainfall intensity indicates the "quantity" of rainfall and is related to the rainfall duration and the design storm. Rainfall intensity is usually represented by an Intensity-Duration-Frequency (I-D-F) curve. The IDF curves for drainage design in Clackamas County are taken from the Hydraulics Manual (see Figures 4-1 to 4-5).
430.2.4 Time of Concentration
- The duration of rainfall is equal to the time of concentration (Tc), in minutes, where the time of concentration is defined as "that amount of time from beginning of a storm event, that it takes water from the most remote time location in the basin to reach the point being considered."
- Determination of the time of concentration, Tc, shall be in accordance with the Hydraulics Manual as follows: Most drainage basins will consist of overland flow segments as well as channel flow segments. Overland flow can be further divided into a sheet flow component and a shallow concentrated flow component. Urban drainage basins may be further complicated by having significant pipe flow segments. The travel time is computed for each flow segment and the time of concentration is equal to the sum of the segment travel times.
The best method of determining overland sheet flow time is the kinematic wave equation. The equation is only applicable for travel distances less than 300 feet.
Tc = KL0.6n0.6 / I0.4S0.3
Where: Tc = overland flow time in minutes
L = overland flow length in feet
n = Manning's roughness coefficient (see Table 4-2)
I = rainfall intensity, in/hr
S = the average slope of the overland area
K = 0.93- Figure 4-6 is a nomograph for the solution of the kinematic wave equation for overland sheet flow. In using the nomograph, the time of concentration and rainfall intensity are unknown. The solution is one of iteration or trial and error.
- After a maximum of 300 feet, sheet flow usually becomes shallow concentrated flow. The average velocity for this flow can be determined from Figure 4-7 in which average velocity is a function of watercourse slope and type of channel. This figure was reprinted from the 1972 SCS Handbook.
- For open channels, Manning's equation can be used to estimate average flow velocity, which is usually determined for bank-full flow.
430.2.5 Design Storm
- A design storm defines the statistical recurrence interval of a storm event. The probability of a 25-year storm occurring in a given year is 4%. Conversely, a 25-year storm will statistically occur once every 25 years. The selection of a design storm is dependent on the balance between the cost of the drainage facility and the flood risks associated with the storm event. The design storm required for public drainage facilities within the County, but outside an existing stormwater district, shall be based on a 25-year storm event. Design storms within existing surface water management districts, shall be based on the districts requirements, but in no case shall public drainage facilities within the County's right-of-way be designed for less than the 25-year storm at basin buildout with 85% impervious.
- The effects of the 100 year storm event on storm drainage structures and bridges shall be evaluated as required.
- The effects of the 100 year storm event on developments within a flood plain shall be evaluated as required.
- The effect of the 100 year storm shall be evaluated when the path of the drainage could place persons or property in jeopardy.
430.2.6 Drainage Area
The discharge of a storm system is dependent on the size of the basin contributing to the flow. The design of a drainage facility should account for the entire drainage basin surrounding the affected area. The Engineer shall submit a topographic map of the entire drainage basin with the drainage calculations. This map should identify the existing and proposed drainage facilities and sub-basins considered in the design. This overall design shall anticipate and accommodate the acceptance and conveyance of surface water on or crossing the roadway or roadway system considered in the design area.
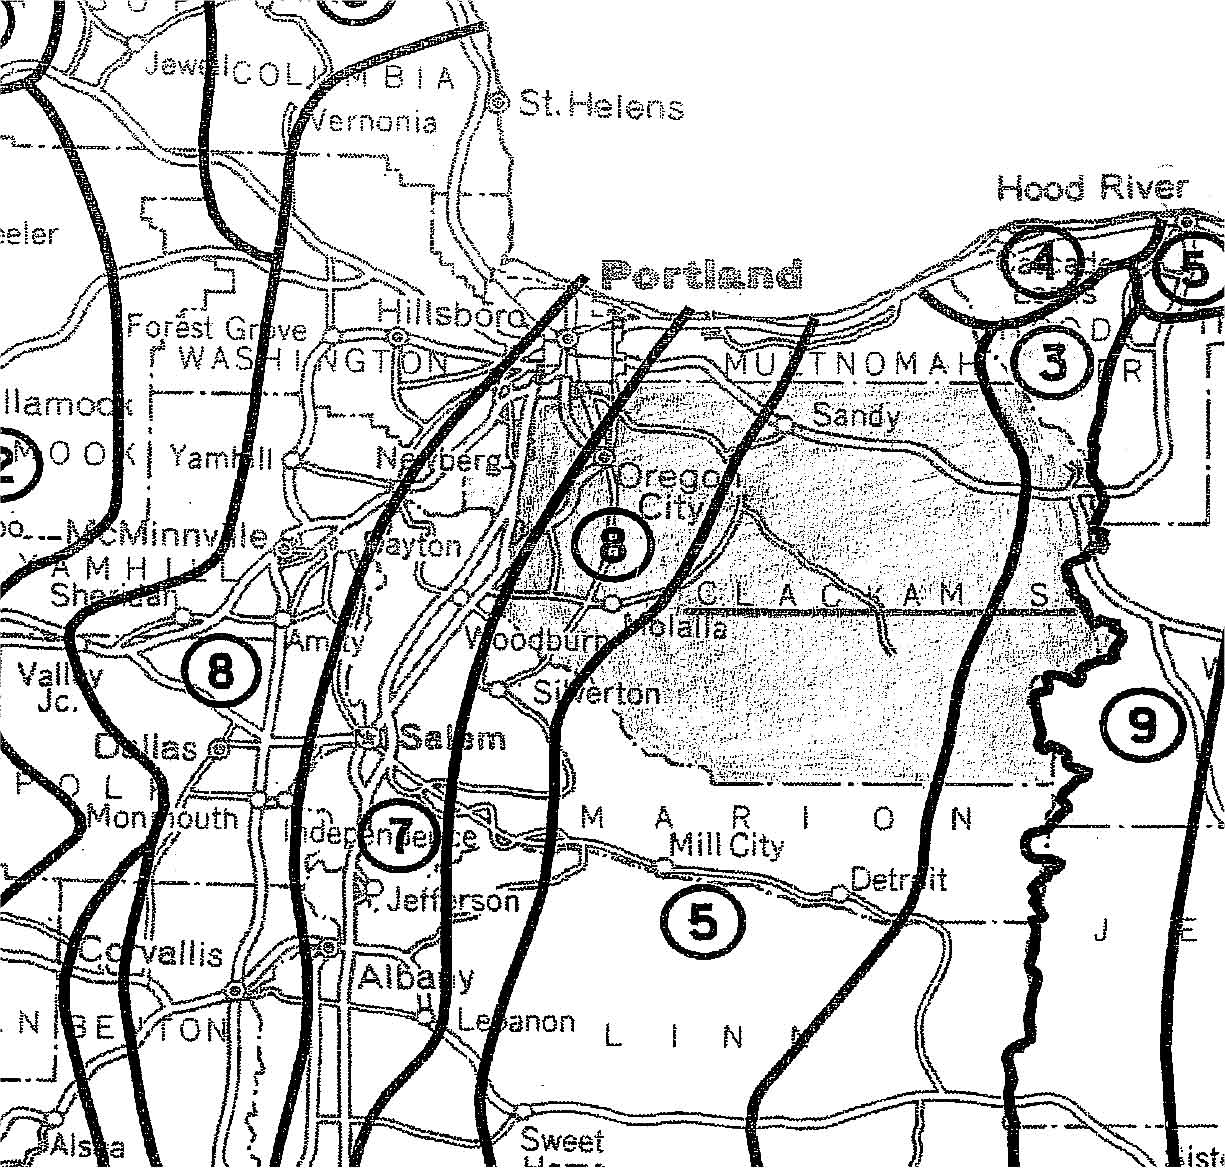
Figure 4-1. Clackamas County Rainfall Zones
Reference: ODOT Hydraulics Manual
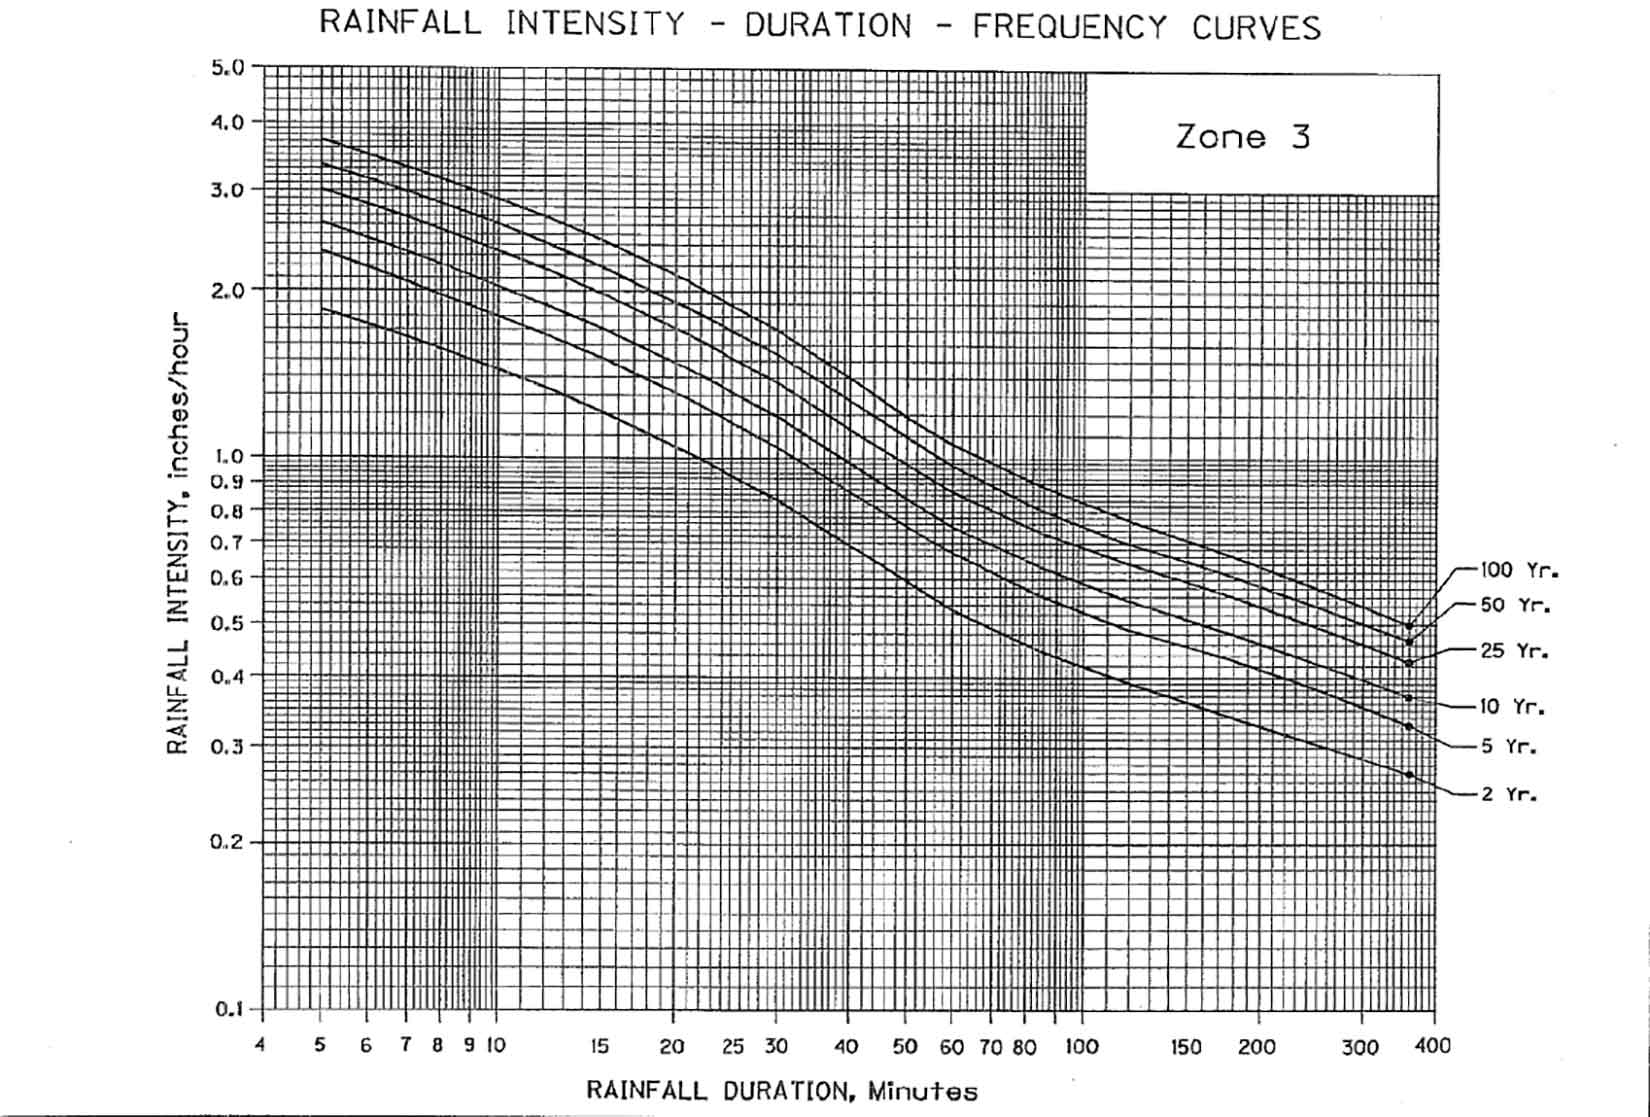
Figure 4-2. ZONE 3 Rainfall Intensity, Duration, Frequency Curves
Reference: ODOT Hydraulics Manual
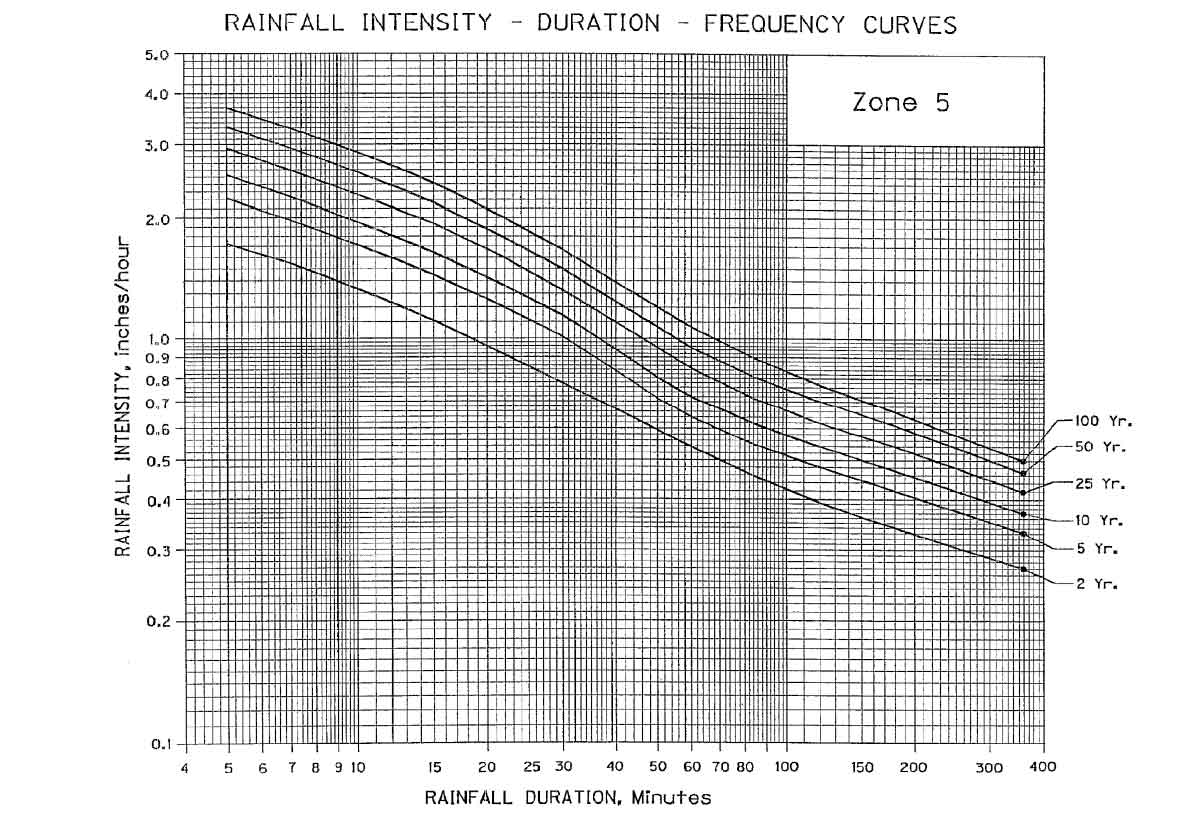
Figure 4-3. ZONE 5 Rainfall Intensity, Duration, Frequency Curves
Reference: ODOT Hydraulics Manual
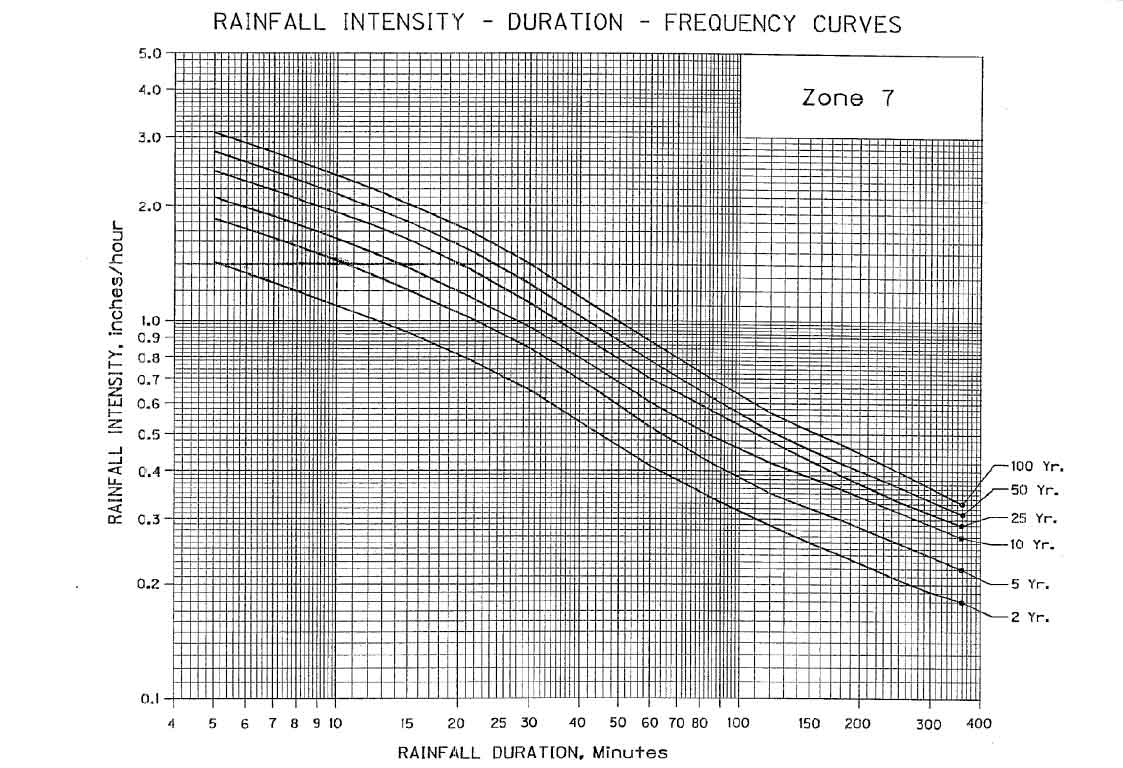
Figure 4-4. ZONE 7 Rainfall Intensity, Duration, Frequency Curves
Reference: ODOT Hydraulics Manual
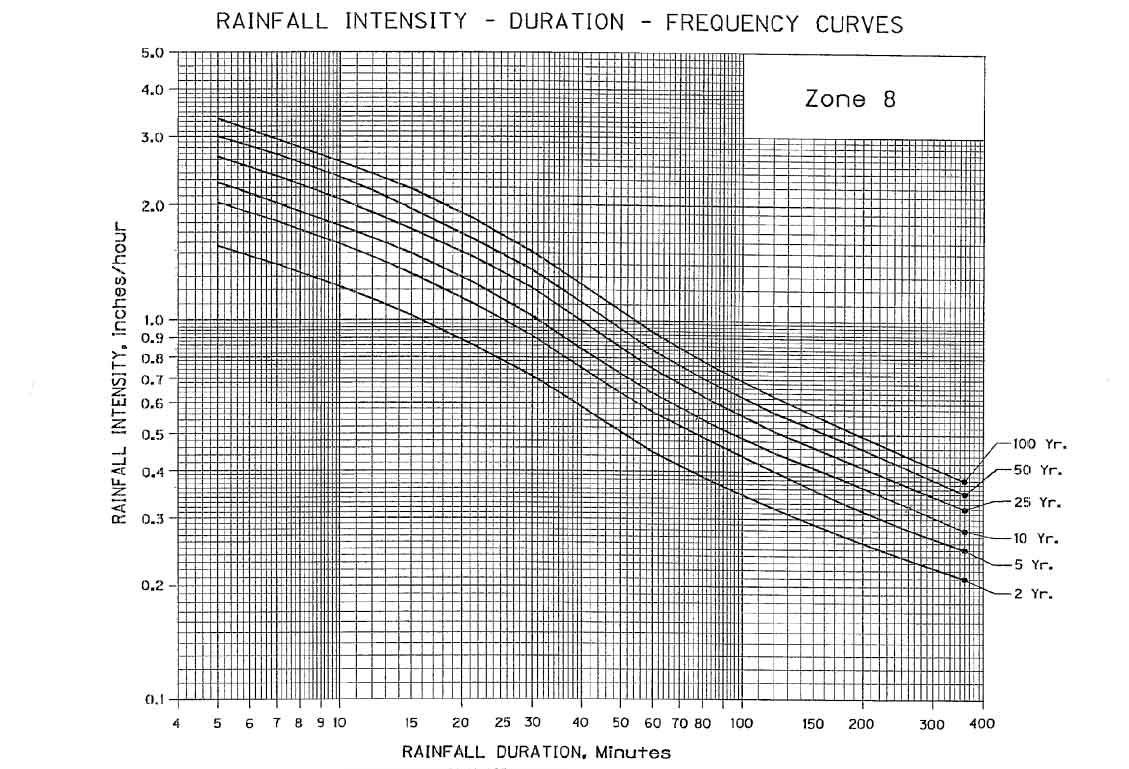
Figure 4-5. ZONE 8 Rainfall Intensity, Duration, Frequency Curves
Reference: ODOT Hydraulics Manual
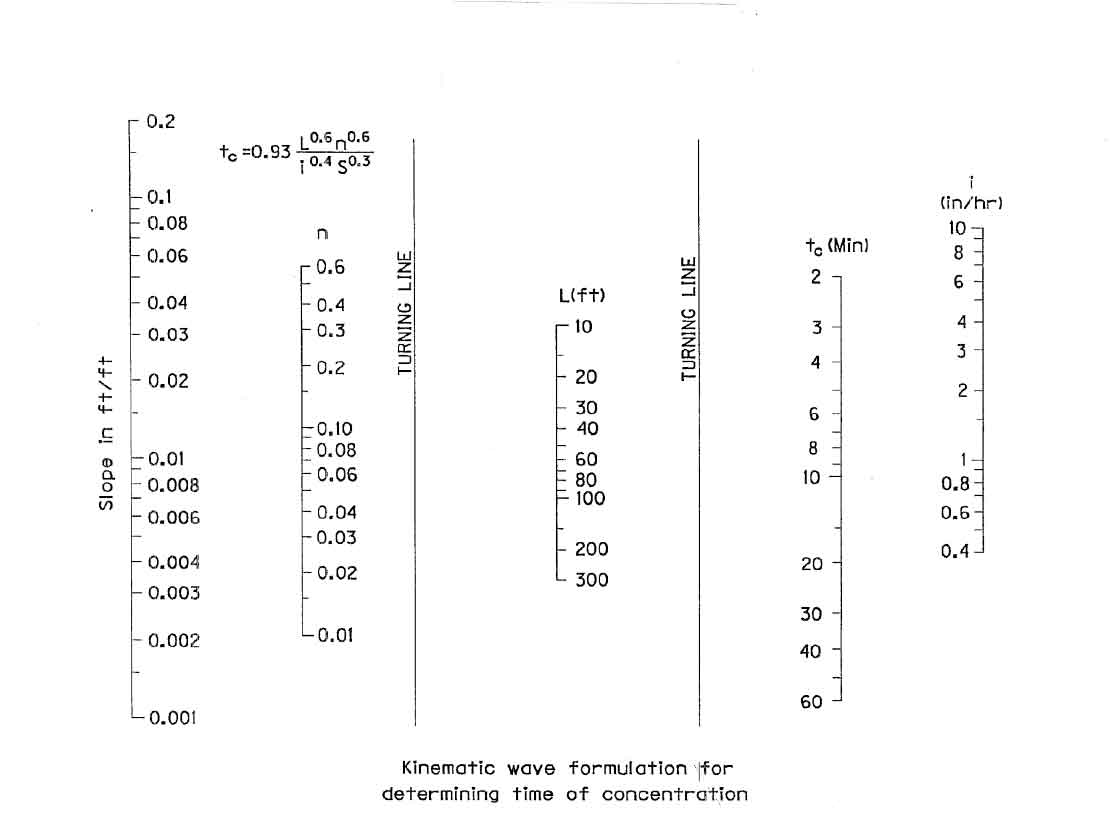
Figure 4-6. Time of Concentration
Reference: ODOT Hydraulics Manual
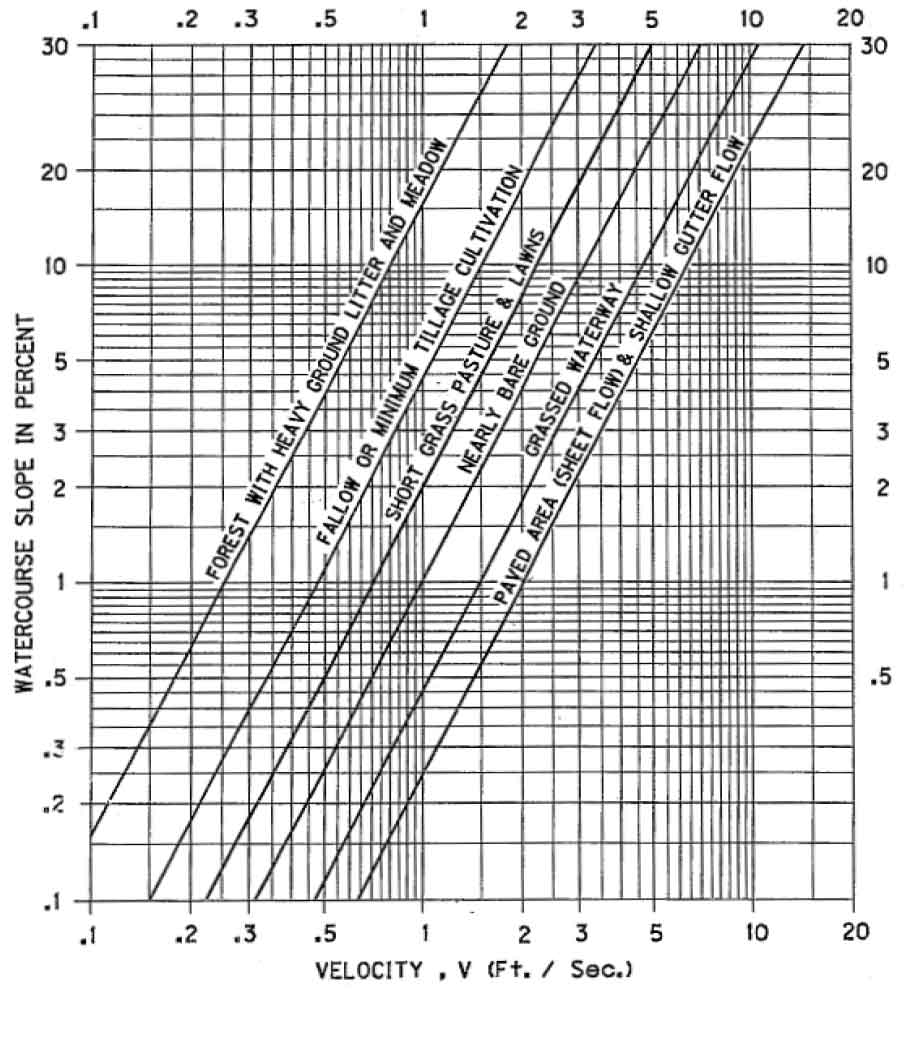
Figure 4-7 – Shallow Concentrated Flow Velocity
Reference: ODOT Hydraulics Manual
A part of the Roadway Standards. Contact engineering@clackamas.us for drawings or information.