TOTAL BUDGET - $247.6 Million
Clackamas Water Environment Services’ (WES) budget for the fiscal year (FY) 2025-26 reflects the resources needed to continue delivering essential services for nearly 200,000 residents, businesses, and other key stakeholders within our diverse service area.
Mission: Why We’re Here
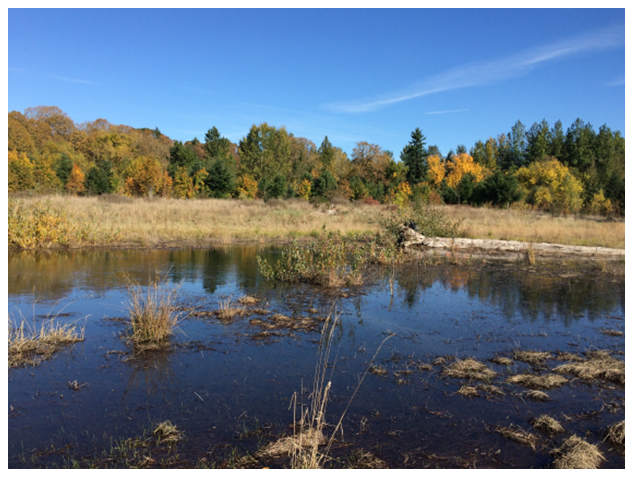
Clackamas Water Environment Services produces clean water, protects water quality, and recovers renewable resources. We do this by providing wastewater services, stormwater management, and environmental education. It’s our job to protect public health and support the vitality of our communities, natural environment, and economy.
Vision: Where We Are Going
Be a collaborative partner in building a resilient clean water future where all people benefit, and rivers thrive.
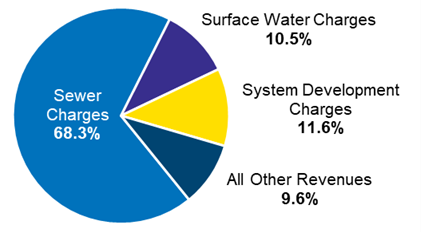
Budgeted Revenue - $69.3 Million
In FY 2025-26, WES’ budgeted revenue comes from:
• Sewer Charges: 68.3%
• Surface Water Charges: 10.5%
• System Development Charges: 11.6%
• All Other Revenues: 9.6%
How WES is Funded
WES is 100% funded by our customers. Monthly sewer and surface water rates, along with system development charges (SDCs) for new connections, fund the cost of operating, maintaining, and building WES’ systems.
WES sets rates carefully to:
- Cover the day-to-day operating costs necessary to treat wastewater, manage stormwater, and protect water quality.
- Fund major capital projects to renew aging infrastructure and support growth.
- Repay debt for system improvements in a responsible, affordable manner.
The Bottom Line: Household Impact
FY 2025-26 rate increases support growing operating and maintenance costs and provide funding for capital projects necessary to maintain safe, reliable infrastructure.
Proposed rate increases average $1.25 per month, or $15.00 annually, for most residential customers.
Even with these necessary increases, WES’ monthly rates for wastewater and surface water remain below the average rates in the surrounding area.
Proposed Rate Increases
Service Rates Comparison
Wastewater*
- Proposed Rate: $54.40
- Existing Rate: $53.60
- Change: $0.80 (1.5%)
- Area Average: $60.89
Surface Water
- Proposed Rate: $9.55
- Existing Rate: $9.10
- Change: $0.45 (4.9%)
- Area Average: $16.04
Total Monthly Bill
- Proposed Rate: $63.95
- Existing Rate: $62.70
- Change: $1.25 (2.0%)
- Area Average: $76.93
*Wastewater rate reflects Rate Zone 2 retail rate, which includes wastewater treatment, local collection, and legacy debt rate components
**Area Average rates reflect rates as of January 1, 2025
What does WES’ Budget Support?
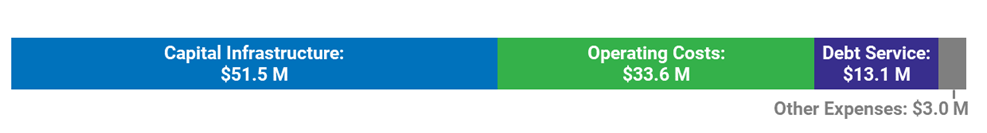
Budgeted Expenditures - $101.2 Million
Budgeted expenditures include investments in capital infrastructure, operating costs, debt service, and other expenses.
Breakdown of Expenditures
- Capital Infrastructure: $51.5 Million
- Operating Costs: $33.6 Million
- Debt Service: $13.1 Million
- Other Expenses: $3.0 Million
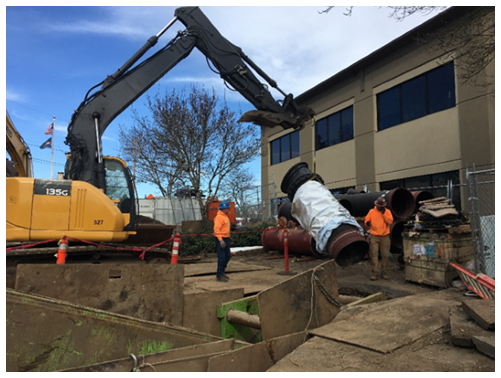
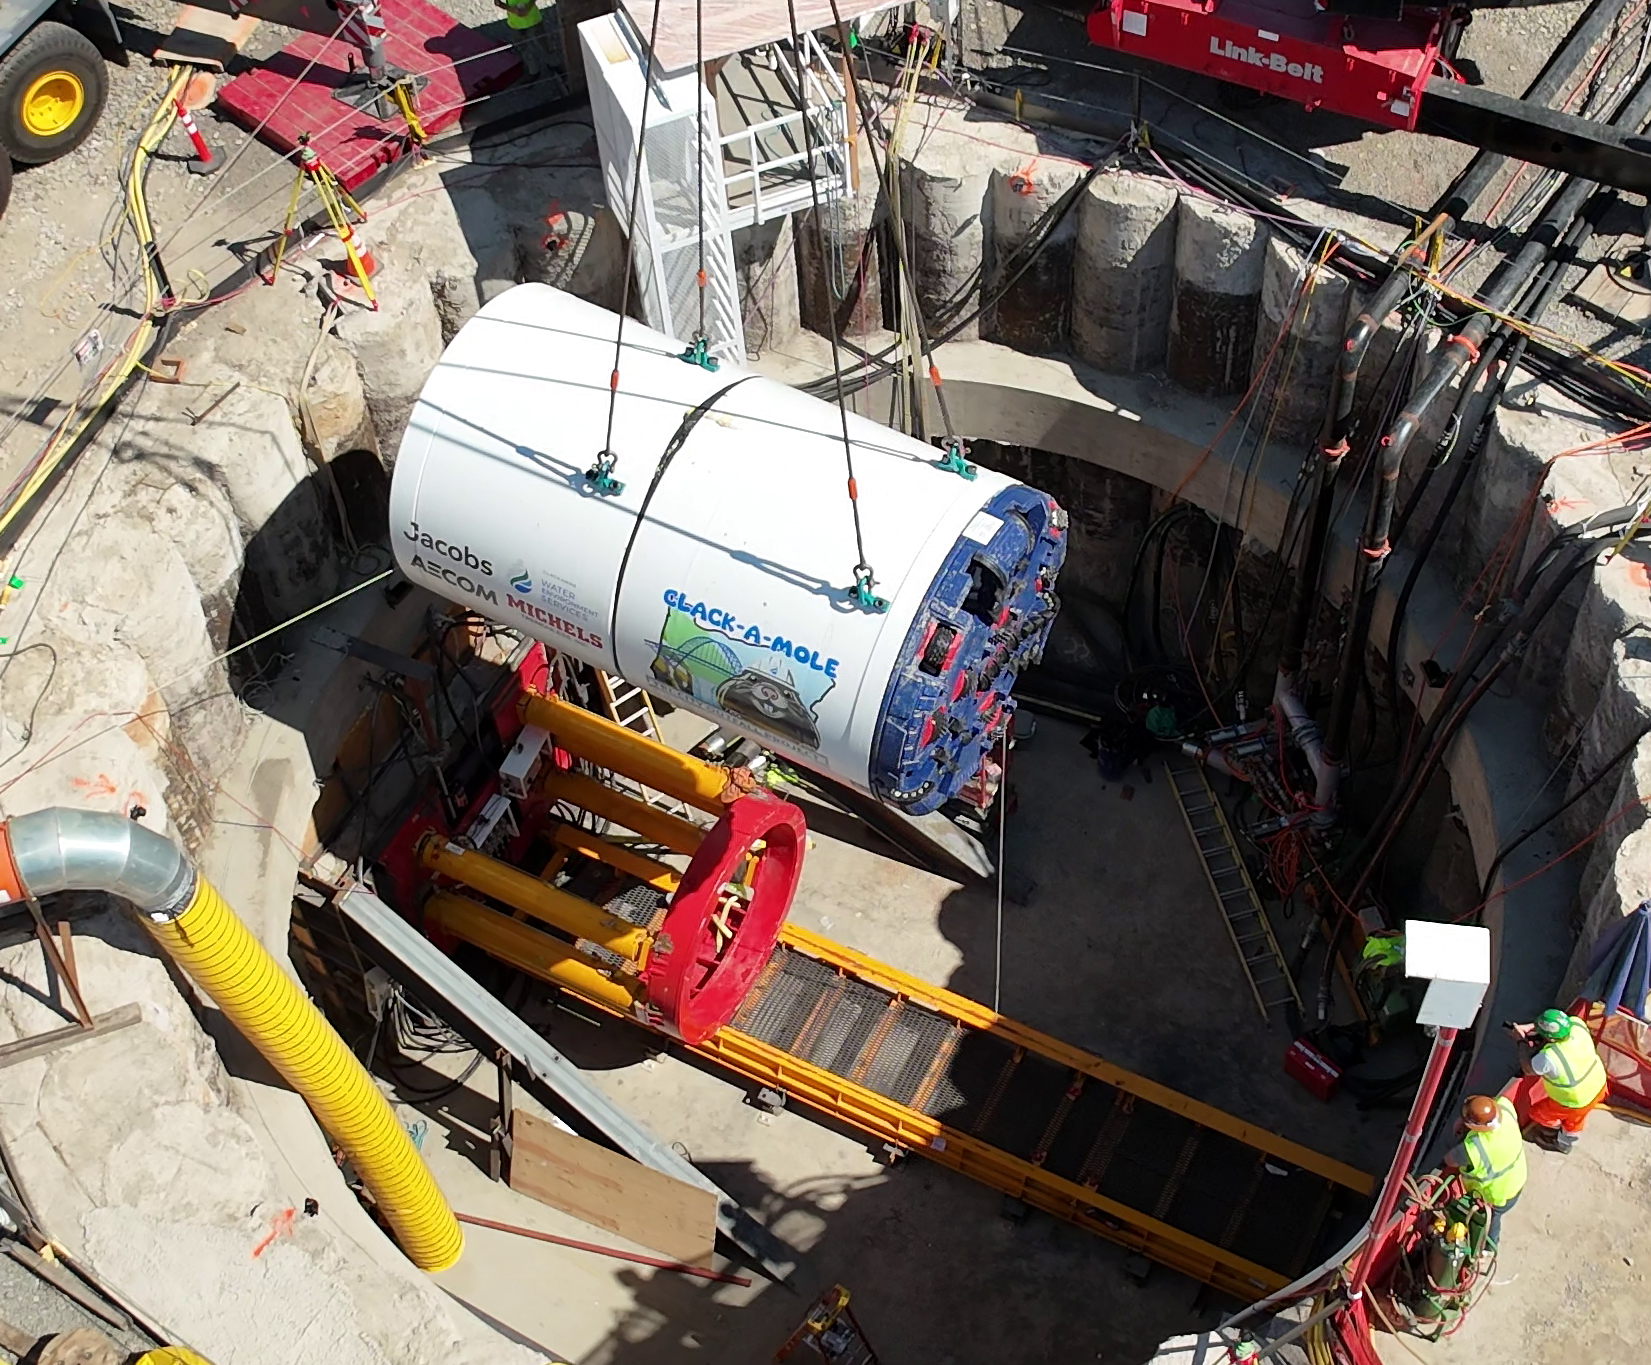
Capital Infrastructure: $51.5 Million
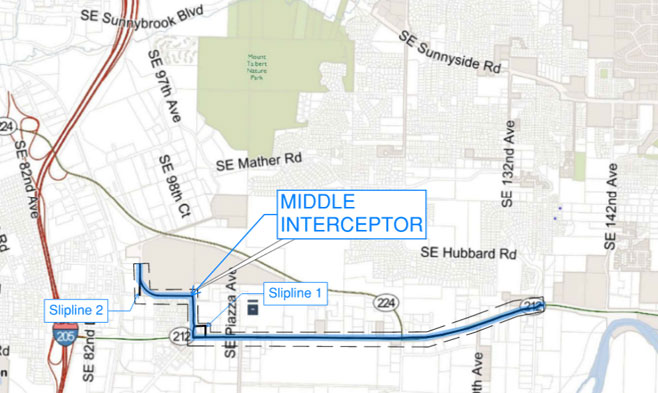
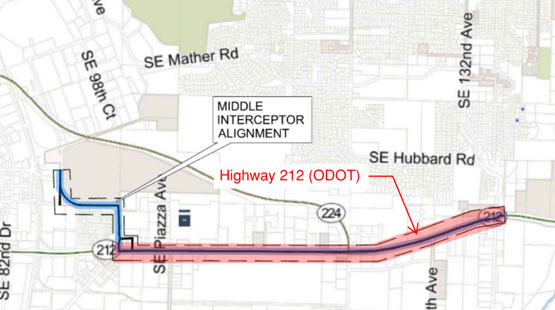
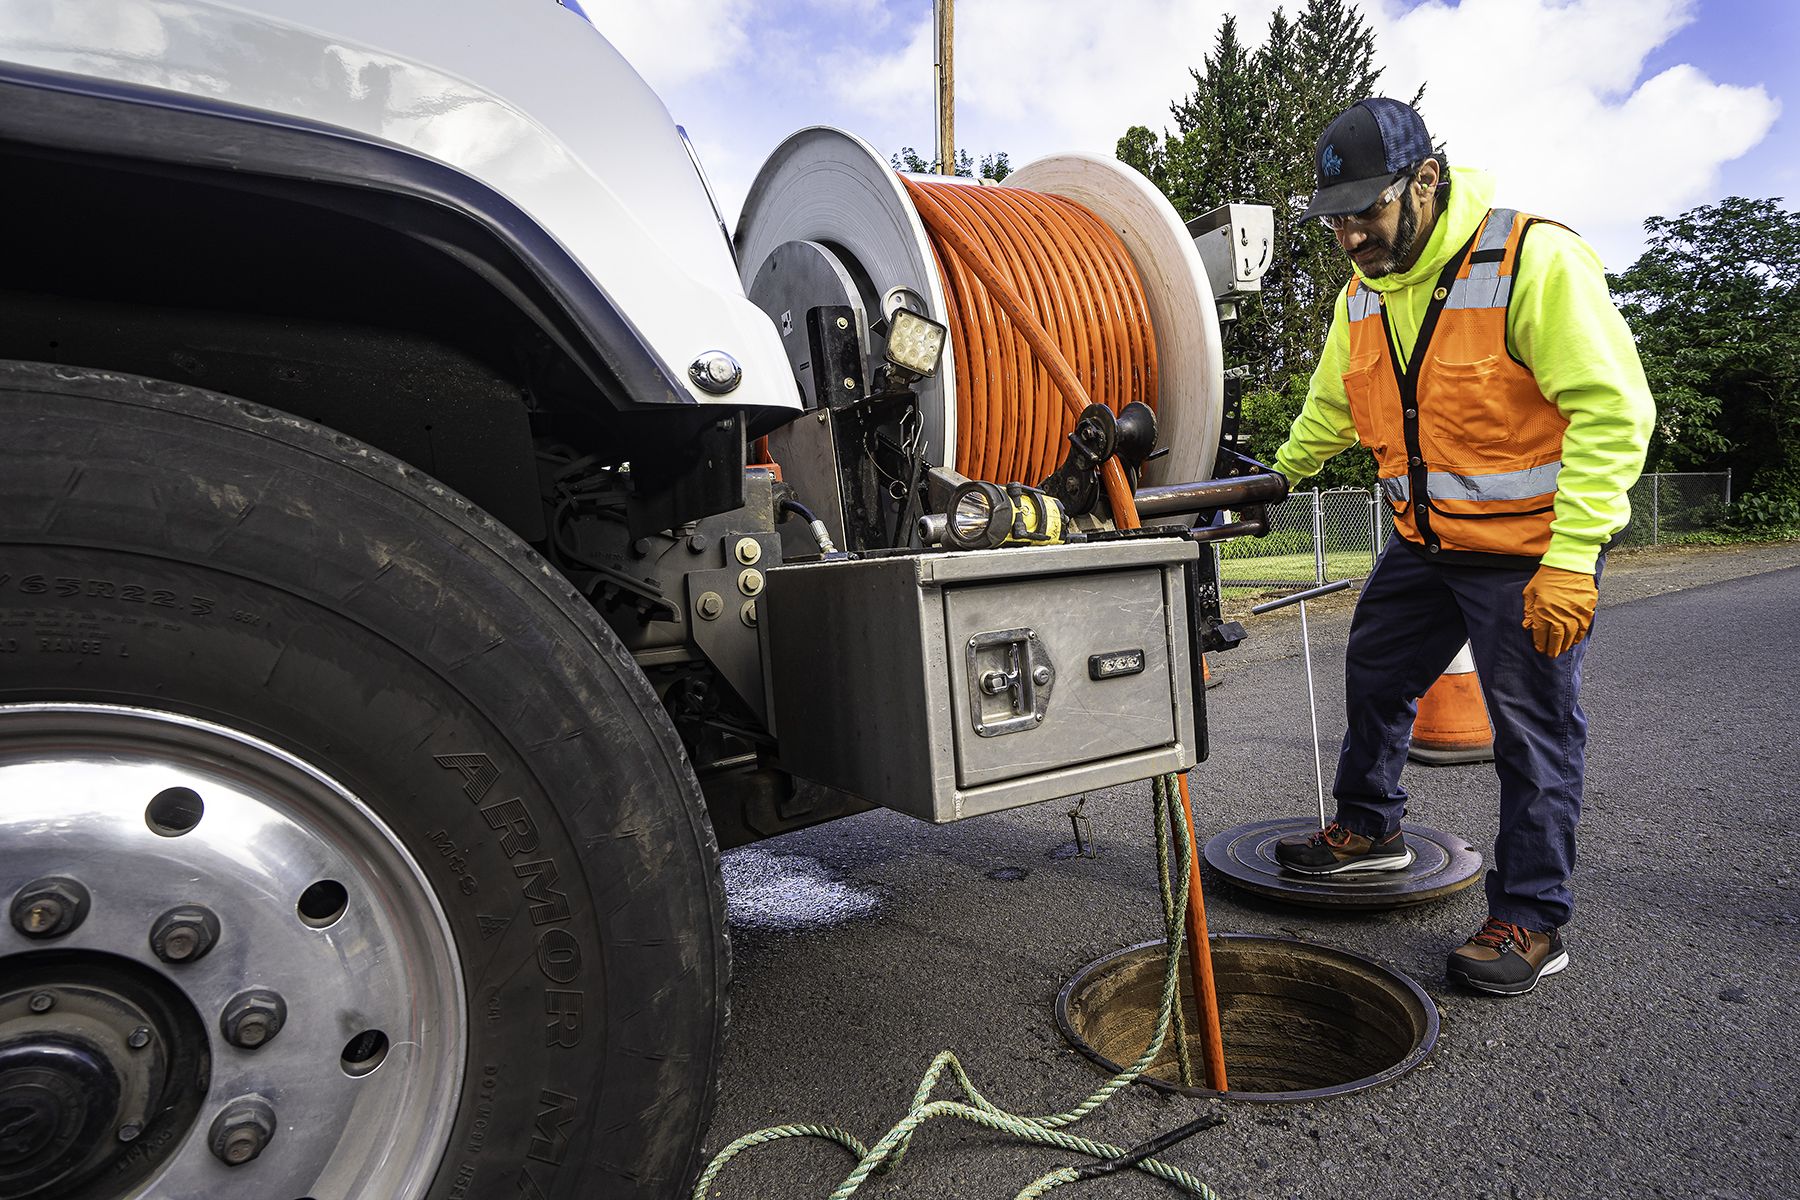
The most significant annual expense for WES is infrastructure spending through the Capital Improvement Plan (CIP). The budget funds 25 distinct wastewater and stormwater capital projects, and 11 recurring capital programs that ensure service reliability and support future growth.
Key projects funded by the FY 2025-26 budget include:
Intertie 2 Pump Station Expansion and Force Main Project
- $9.0 Million
- Expanding capacity to ensure reliable sewer service
Tri-City Water Resource Recovery Facility Outfall Project
- $5.5 Million
- Building a new outfall to handle future peak wastewater flows
Three Creeks Water Quality Project
- $3.8 Million
- Restoring wetlands, floodplains and wildlife habitat
Operating Costs: $33.6 Million
Operating costs consist of all budgeted expenses incurred to provide sewer and surface water management services to meet customer needs and maintain WES’ treatment and collection systems.
The budget funds a dedicated staff of 121 full-time positions to ensure our critical facilities operate around the clock to protect public health and the environment.
Debt Service: $13.1 Million
WES uses long-term financing to spread the cost of major capital projects over time, helping to keep rates predictable and affordable.
Strong financial management has earned WES a AAA credit rating, the highest rating available.
Other Expenses: $3.0 Million
Other Expenses include special payments for city right-of-way (ROW) fees, good neighbor agreements, and a required federal arbitrage rebate payment.
WES by the Numbers
- Nearly 200,000 customers served across urban and rural communities
- 15+ million gallons of wastewater treated each day
- Over 600 miles of sewer and stormwater pipes maintained
- 24/7 operations of 5 Water Resource Recovery Facilities and 23 Pump Stations
Get Involved
WES’ Budget Committee will meet on May 27, 2025 to review the proposed budget. The Board will consider WES’ budget and rates for adoption in June. Visit www.clackamas.us/budget for additional details.
Contact Information
Clackamas Water Environment Services
150 Beavercreek Rd. #430
Oregon City, OR 97045
www.clackamas.us/wes
Printable pdf version
 Translate